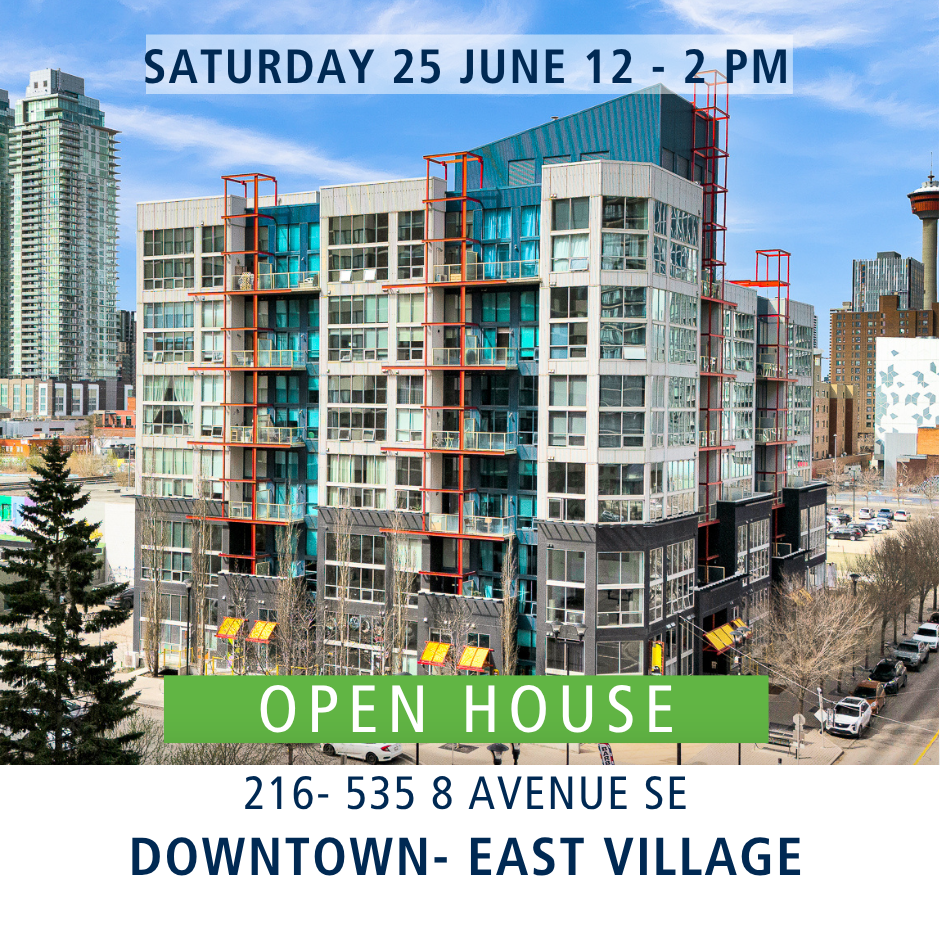
You're Invited to Our Open House This Saturday!
If you've been searching for an affordable inner-city condo, this is the perfect opportunity to see one in person.
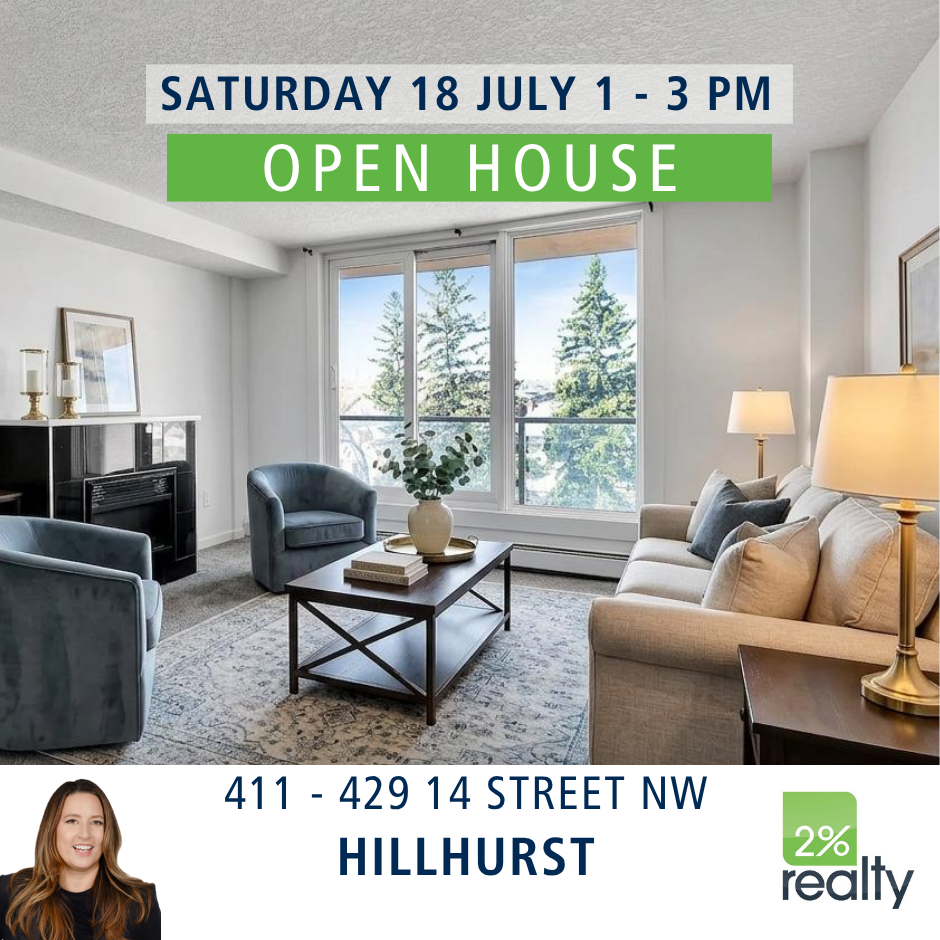
Join me Saturday, July 18, from 1:00 PM to 3:00 PM to tour this NW corner condo located in the desirable Hillhurst/Kensington area. The lowest priced 2 bed condo in NW inner-city in a CONCRETE BUILDING with INSUITE LAUNDRY!
Why You'll Want to Visit
As soon as you step inside, you'll notice how bright and welcoming this home feels. Large windows on two sides fill the nearly 850 sq.ft. layout with natural light while offering beautiful views over Hillhurst and St. Andrews Heights.
The thoughtfully designed floor plan features:
- Two generous bedrooms
- Spacious living room with fireplace
- West-facing balcony
- Granite countertops
- Stainless steel appliances including a gas stove
- Breakfast bar
- In-suite laundry
You'll also appreciate the convenience of:
- Heated concrete construction for quiet living
- Parking stall
- Storage locker
- Fitness centre
- Bike room
An Excellent Location
Enjoy being minutes from restaurants, coffee shops, shopping, parks, transit, schools, downtown Calgary, and the Bow River pathway system.
Whether you're buying your first home, looking to downsize, or adding an investment property to your portfolio, this condo offers exceptional value.
Join Me This Saturday
Saturday, July 18
1:00 PM – 3:00 PM
Come explore everything this home has to offer. I look forward to meeting you and answering any questions you may have.
Adrienne McGarvey REALTOR® | 2% Realty | 403.801.2012